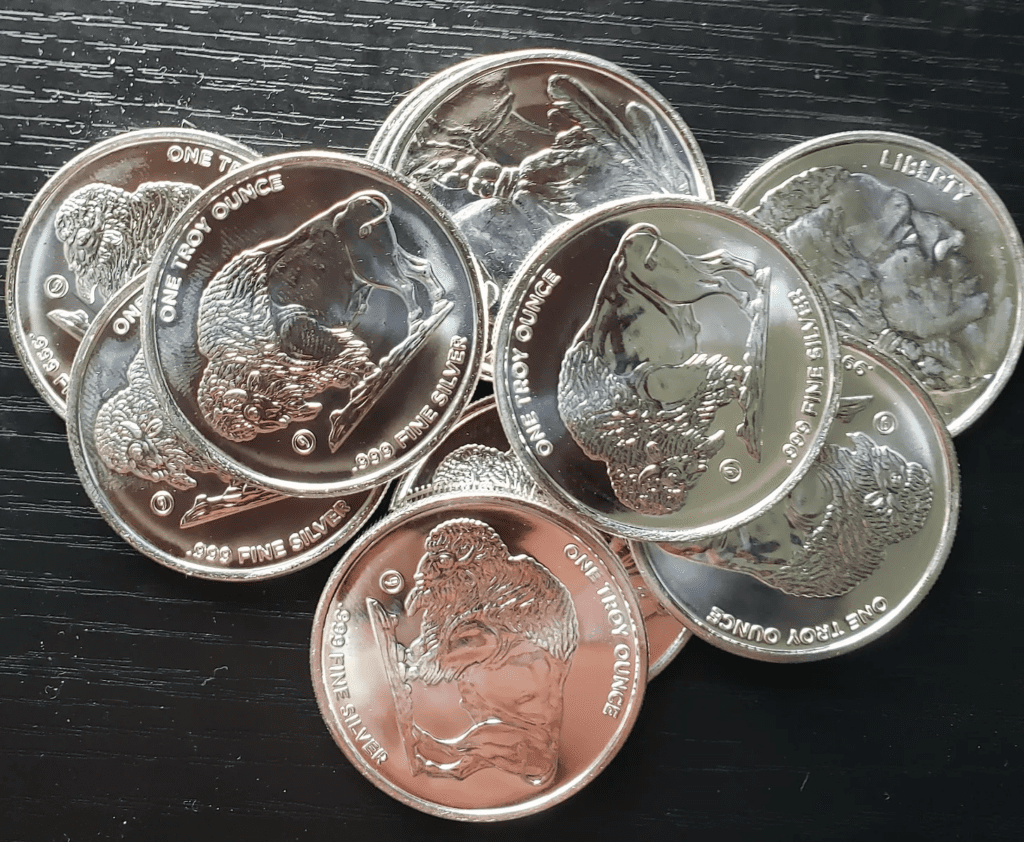
Thanks to the Mineral WEALTH Substack for this one
Author:
JOHN RUBINO
(CNBC) – Pending home sales, a measure of signed contracts on existing homes, dropped 1.5% in October from September.
I visited a local coin shop last week to see what they had in stock. And the answer was…nothing. They had not a single silver bullion coin.
How can a coin shop function without its most basic product? “Everyone wants to buy silver, and no one is selling,” explained the owner. So instead of maintaining inventory, she keeps a list of customers who want silver, and when some comes in she calls those people, who swing by and claim it. As a result, silver doesn’t sit around waiting to be bought by walk-ins like me.
This kind of supply/demand imbalance happens periodically in small, thinly traded markets like silver, and it usually precedes a nice upward price move. Ever since that visit, I’ve been thinking about what it would take to get silver’s price up to, say, $100.
Then a post on this exact subject arrived from the Mineral WEALTH Substack. Here’s a lightly edited excerpt:
New Solar Installations exceed 2500 GW by 2030. Doing the math means 1.25 billion ounces of Silver.
According to a global PV outlook report from BloombergNEF, new solar installations reached 413 GW in 2023, surpassing previous forecasts. The report predicts that new installations could reach 511 GW in 2024, 531 GW in 2025, and 727 GW in 2030.

Some takeaways:
- 1 GW of solar = 500,000 ounces of Silver.
- 2500 GW = 1,250,000,000 ounces of Silver.
- Global Mining production may hit 840 million ounces in 2024, down about 5% in the past decade.
- To reach 2500 GW would be more than all Silver produced Globally across an entire year.
Keep in mind BRICS. Russian economist Sergey Glazyev (touted by Credit Suisse’s Zoltan Pozsar) engineered the BRICS architecture of 1 gram of gold per 2 barrels of oil. CitiBank projects $100 oil = $5,600 gold, whereas a 60-1 Gold to Silver Ratio yields Silver at $93.33 per ounce; at 70-1, Silver is at $80 per ounce. With today’s 88-1 ratio (which will drop), that is $63.63 per ounce of Silver (if BRICS is correct). We think they are.
To sum up, the supply/demand imbalance that currently plagues coin shops might be replicated on a global scale as silver mine supply stagnates and a new source of demand — solar power — soaks up excess inventory.
Some of the above numbers — like solar power growth five years hence — are a bit speculative. But generally, one path to $100 silver involves gold rising while the gold/silver ratio falls due to rising silver demand. Adjusting the math a bit to account for past gold/silver ratio toughs, let’s say gold hits $5000 (which in a rational world it already would have) and the gold/silver ratio falls to 50. That puts the silver price at exactly $100.
So watch the moving parts: solar installations, silver used per panel, silver mine production, the oil price, and BRICS monetary pronouncements, and let’s see how they fit this scenario.
And definitely get some bullion now. If your local dealer is tapped out, find a reliable online source. I just tested Walmart.com’s coin offerings (which route through APMEX) for 10 buffalo rounds, and it was as simple as any other online transaction.


