By Kelsey Williams for Neptune Global
Gold has again broken through $2000 oz. and closed above that price. Certainly that is significant. We know that the current price of gold is near its all-time high and has flirted with that same point on several occasions in the past three years.
However, with a focus on the U.S. dollar and the effects of inflation, perhaps we can provide some additional perspective by looking at some simple historical charts.
Below is our first chart (source). It shows a recent three-year history of the physical gold price using monthly average closing prices…
CHART NO. 1
Gold Prices – 3-year Historical Chart
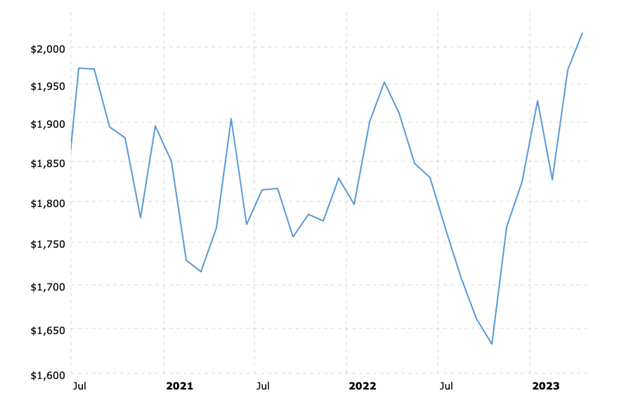
The chart above (Chart No. 1) indicates that the gold price has now broken above all previous peaks dating back to and including the peak in July/August 2020.
Below is our second chart. It has the same gold price history except that the prices have been adjusted for inflation…
CHART NO. 2.
Gold Prices (inflation-adjusted) 3-year Historical Chart
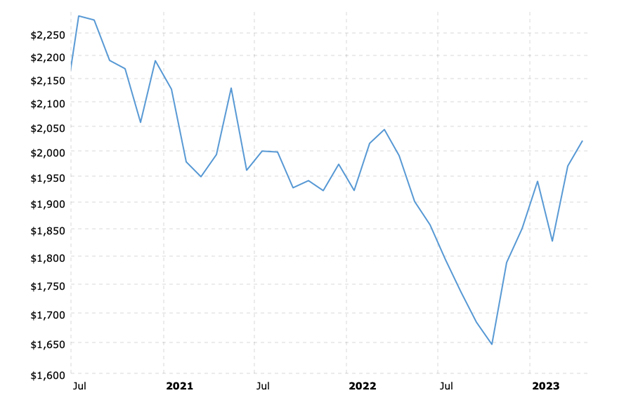
What Chart No. 2 shows us is that when measuring for the actual loss of purchasing power in the U.S. dollar since its peak in 2020, the gold price has actually been in a well-defined downtrend and has not as yet exceeded any of the previous price peaks.
Here is Chart No. 3 which dates back to the gold price peak in August 2011…
CHART NO. 3
Gold Prices (inflation-adjusted) 12-year Historical Chart

In Chart No. 3 we see that gold is well below its price peak from twelve years ago. The intra-day price peak for gold in 2011 was $1896 oz. Now, with the effects of inflation since then, the gold price needs to exceed $2400 oz. just to match that price in today’s cheaper dollars.
Our fourth and final chart shows a gold price history dating back to January 1980 when the gold price peaked on an intraday basis at $843 oz. The January 1980 average closing price for gold was $677 oz…
CHART NO. 4
Gold Prices (inflation-adjusted) 43-year Historical Chart
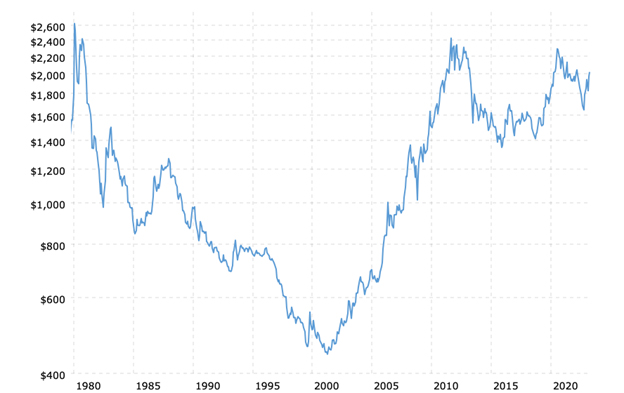
In Chart No. 4, we see that the effects of inflation have a dramatic impact on the gold price over the long term. In today’s cheaper dollars, the gold price needs to exceed $2600 oz. just to match the 1980 price of $677 oz.
SUMMARY
When you hear others talking about the gold price breaking above all-time highs, here are some facts to remember…
- The real price of gold is ever changing with the effects of inflation.
- The gold price reflects the effects of past inflation.
- At $2000 oz. today, gold is still much cheaper than its price peaks in 2020, 2011, 1980.