Authored by Kelsey Williams for Neptune Global
GOLD MINING STOCKS VS GOLD
Most investors who own gold mining stocks are in them because they expect higher prices for gold. In addition, they expect their gold mining stocks to outperform gold.
With the assumption of relatively fixed mining costs for gold, a higher gold price increases the potential selling price for the end product. That increasing profit margin translates to expected higher profits for the company and a higher share price for owners.
There is a leveraged effect that produces higher profits per dollar invested by owning gold mining stocks rather than physical gold. For example…
If a gold mining company has mining costs of approximately $1400 oz and can sell their end product for $1900 oz., the profit is $500 oz. If the price of gold moves up to $2400 oz., there is additional profit of $500 oz.; or, $1000 oz. total ($2400 – $1400 = $1000).
The example in the above paragraph is simple and crude. There are a host of factors (time, increased mining costs, capitalization of the company, labor problems, etc.) which interfere with the simple logic illustrated. Hence, actual results can and do vary.
In the past, estimates of the potential leverage effect in favor of owning gold mining stocks range as high as 2 or 3-to-1. If the actual results were anything close to that estimate, then it would justify the proclaimed merits of owning gold stocks rather than physical gold.
DOES IT WORK – HAS IT WORKED?
Let’s find out. Below is a chart of gold prices beginning in October 2000 when gold was priced at $270 oz…
Gold Prices – Historical Chart
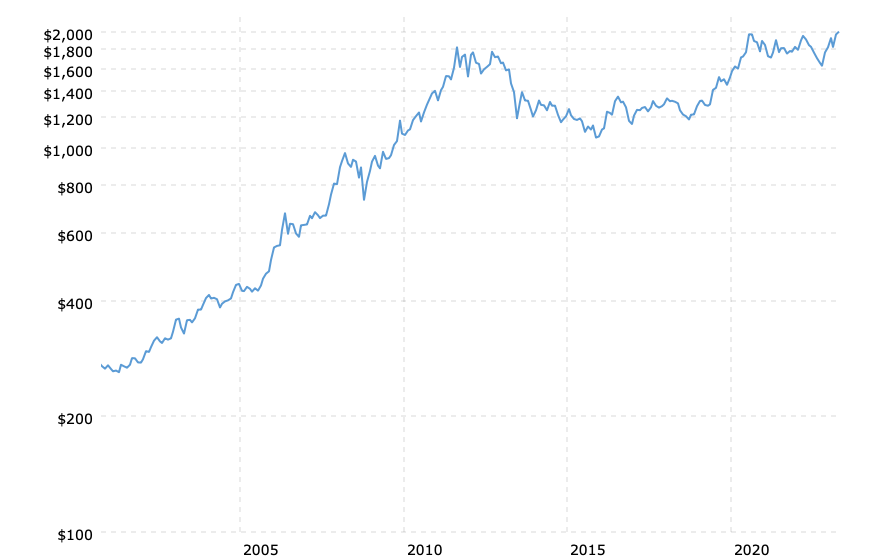
As seen in the chart above, there is a clear uptrend in the gold price for more than two decades.
The next logical chart would be one that shows how gold stocks performed over that same period. But that would not tell us what we need to know.
We need to know how gold stocks performed relative to the increasing gold price. The next chart does just that. It depicts the changing ratio of the HUI, an index of gold mining stocks, compared to the price of gold.
What we want to see is a ratio that increases over time. That would indicate that gold stock prices are accelerating more rapidly than the price of gold itself – a picture of the positive leverage effect explained above…
HUI to Gold Ratio
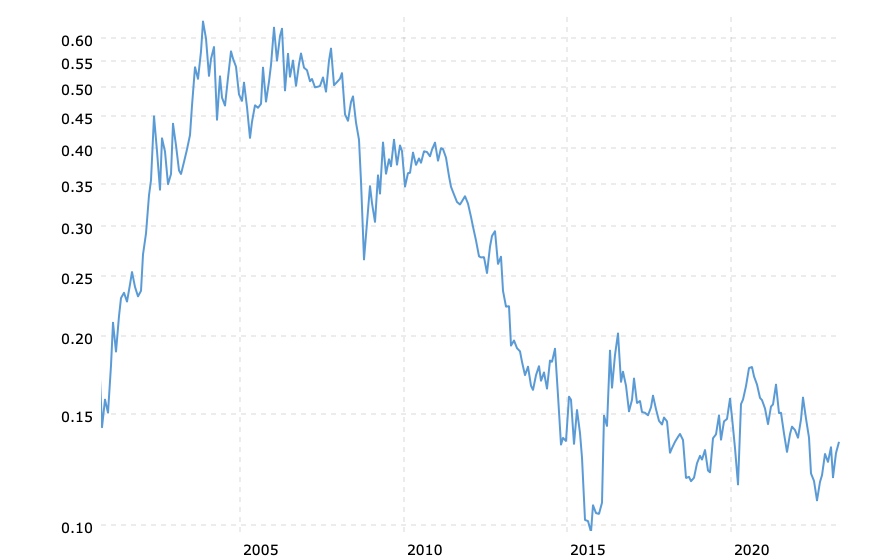
Initially, for the first three years (2000-03), gold stocks outperformance was nothing short of spectacular. After that, gold stocks struggled to keep pace with the rising gold price. When gold declined in price, gold stocks fell farther, faster.
After peaking in 2011, gold stocks declined by more than eighty percent over the next four and one-half years – twice as much of a decline as in the price of gold.
The price of gold today is higher than its 2011 peak by about six percent. However, gold stocks as a group are lower by almost sixty percent.
GET THE REAL DEAL
There are short periods of time when a speculator can make money buying gold stocks rather than gold. Those times are few and far between. The history of underperformance by gold stocks relative to gold has been evident for more than fifty years.
Don’t be swayed by the arguments in favor of gold stocks over gold. And don’t lull yourself to sleep with the false assumption that gold stocks are a good long-term investment. They are not. Over time, they tend to lose money.
Get gold. Get the real deal.